
Coverage (Panel)#
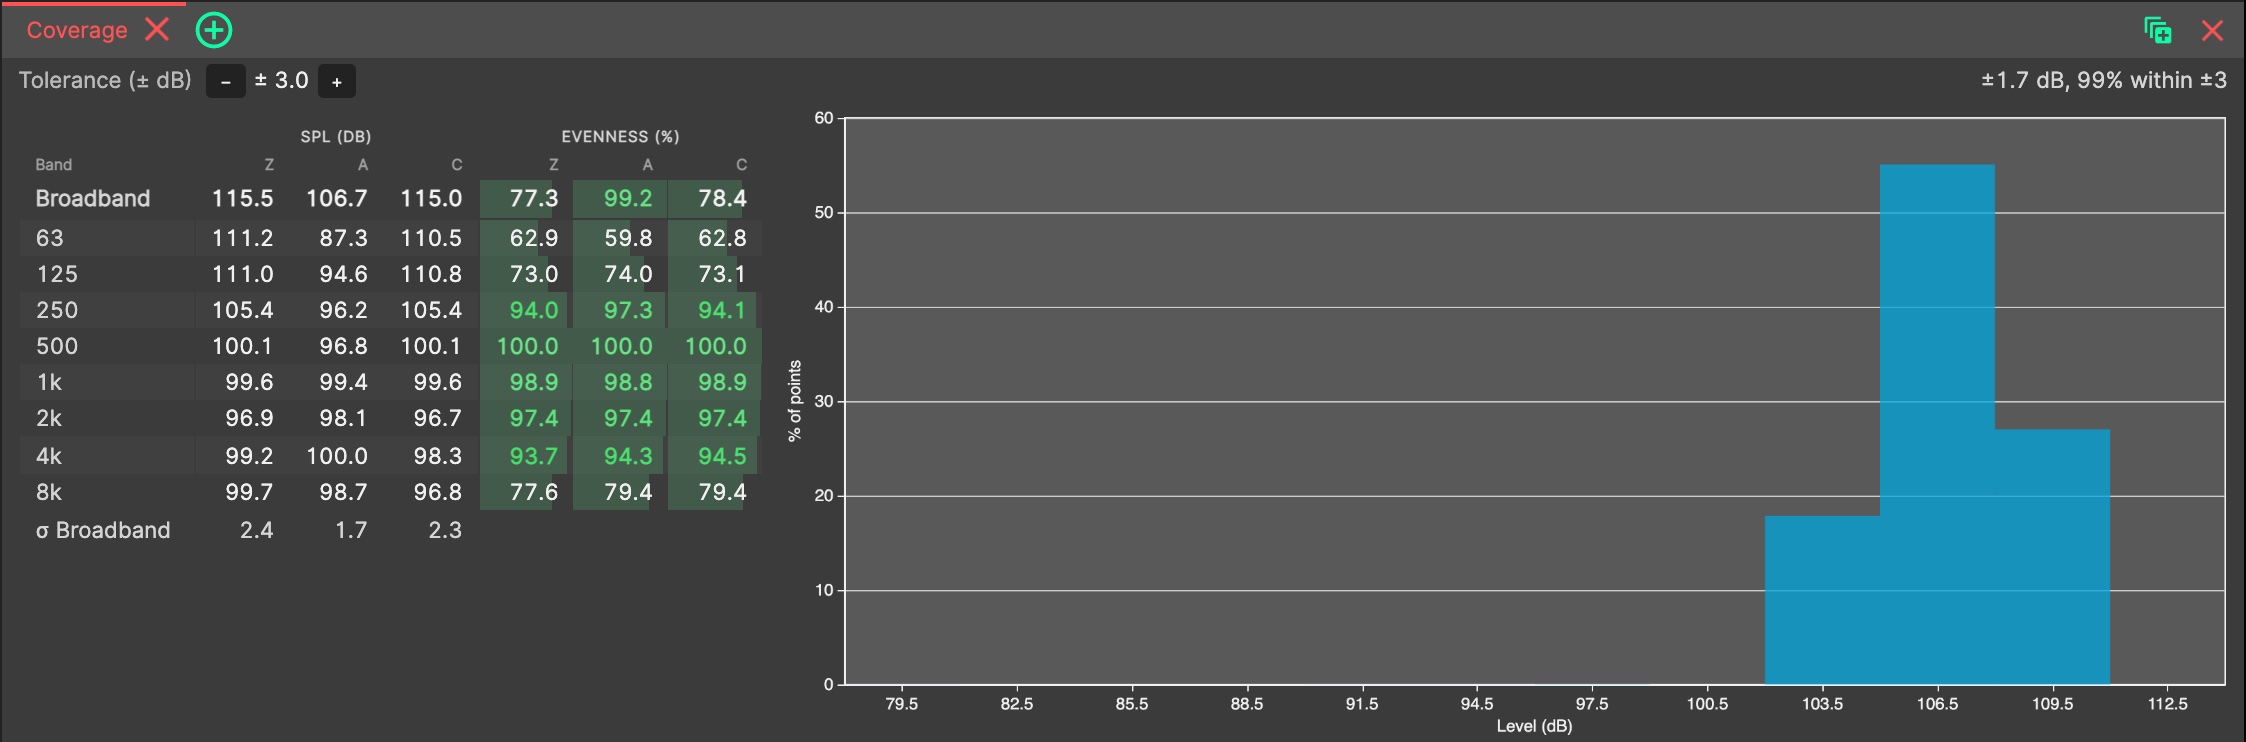
The Coverage Panel summarises how even your SPL coverage is, in numbers.
Open it from the panel add menu in the 3D SOURCES, 2D SOURCE or custom tabs, with SPL mapping switched on - the statistics cover exactly the points the heat map draws.
- Statistics Table
One table shows average SPL and evenness (Z, A and C weighted) for the broadband and each octave band from 63 Hz to 8 kHz, with a footer row giving the broadband spread (standard deviation) per weighting. Below the table, a histogram shows the distribution of the band the heat map is currently displaying - choose it with the stimulus/band/weighting dropdowns in the 3D View’s header.
- Tolerance
Set the Tolerance (± dB) with the − / + stepper to define the evenness window used by the table, the histogram and the badge. The badge shows the spread and the percentage of points within tolerance.
- Cutting Planes
Cutting planes re-scope the statistics: slice the venue in the 3D View and the tables, histogram and badge follow, so the evenness of a single zone can be assessed in isolation.
As with all Panels, the Coverage Panel can be resized and moved using Panel Drag & Drop, and ‘popped out’ into an additional System Optimiser window. The location of this Panel will be saved as part of the current tab.