
SPL over Distance (Panel)#
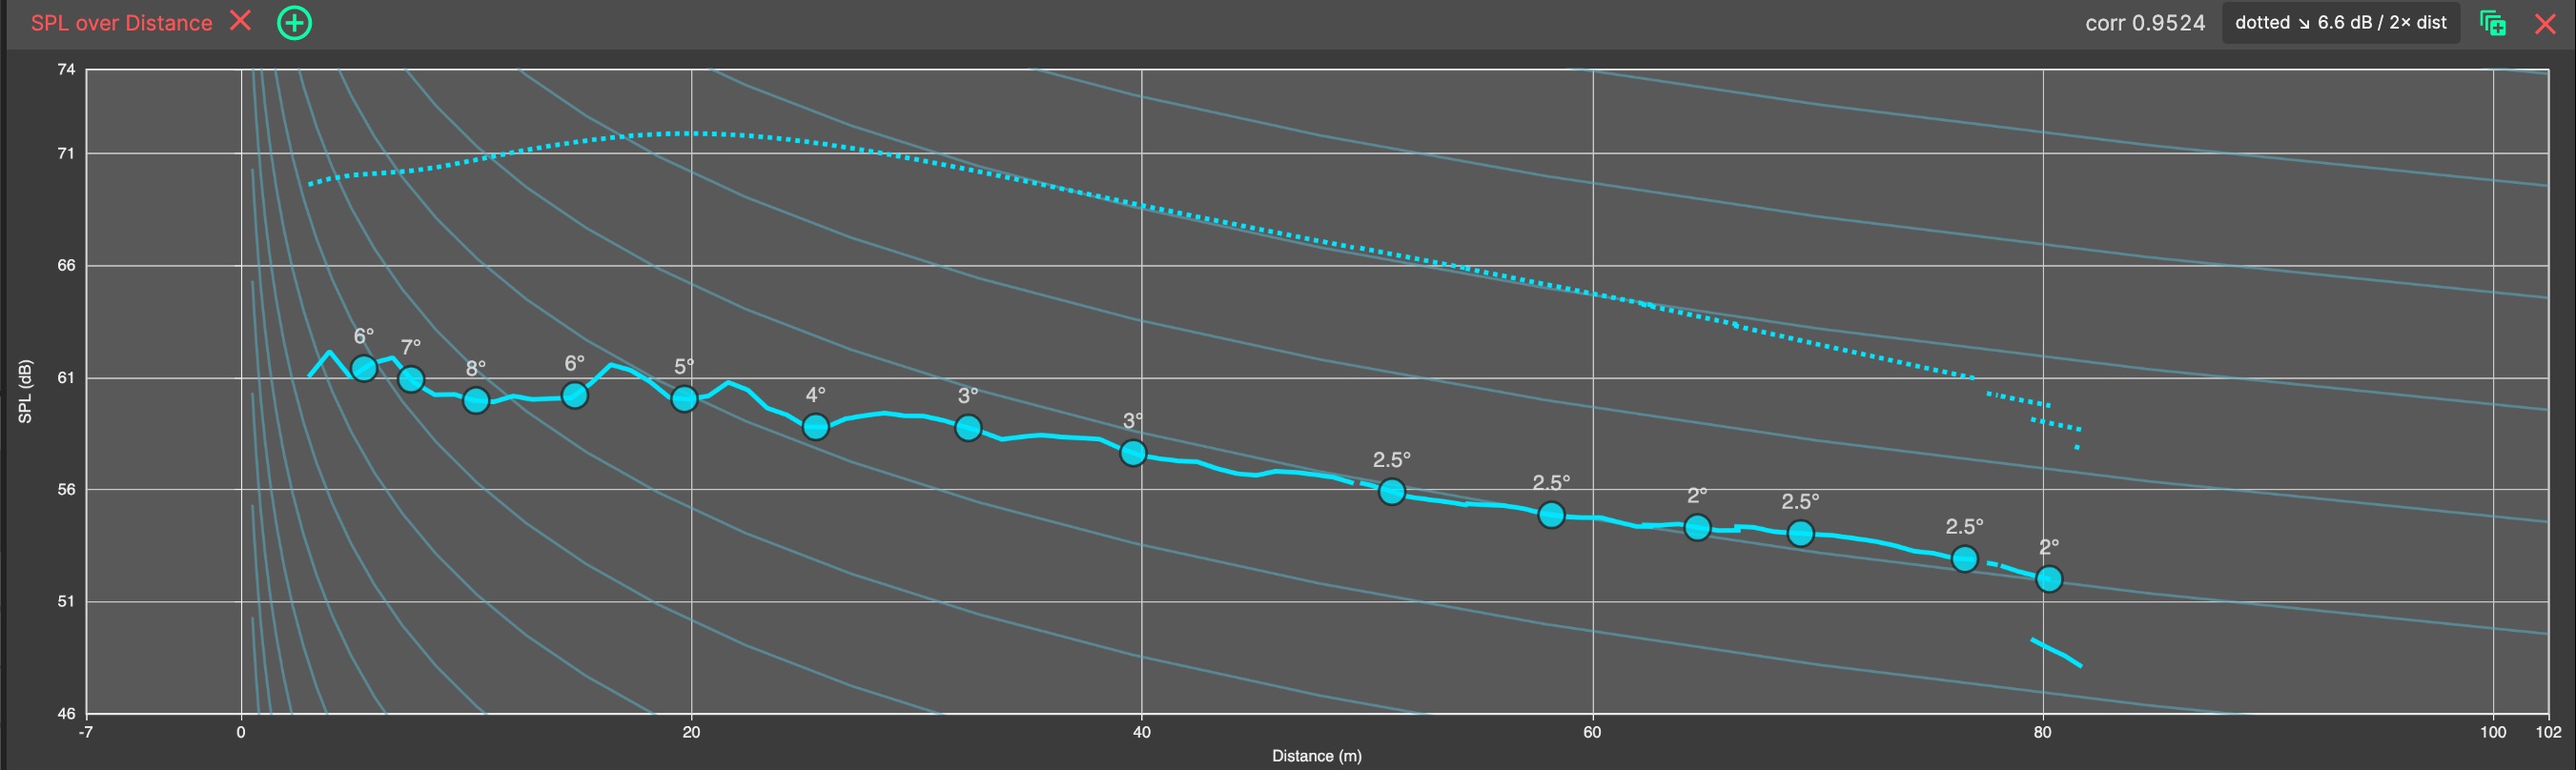
The SPL over Distance Panel is a chart which plots SPL against distance along the audience, for the array selected in the Sideview. It gives an immediate picture of how evenly the array’s level is distributed from the front to the back of the venue.
The SPL over Distance Panel is part of the default 2D SOURCE layout, and can be opened from the panel add menu in the 3D SOURCES, 2D SOURCE or custom tabs. Use it alongside a Sideview.
- Up to Three Bands
The chart plots two traces per audience area - one dotted, one solid - each showing an SPL band of your choice, configured in the SPL Over Distance Settings. By default, the dotted trace shows 80-250 Hz and the solid trace 1-10 kHz, so the low-mid and mid-high behaviour of the array can be compared at a glance. An optional third, dashed trace can be switched on in the same settings - for example to show the Broadband, A-weighted level. Broadband traces can use any weighting. A legend in the top-right corner of the chart names the band of each trace.
- Following the Sideview
The distance axis tracks the Sideview exactly: pan or zoom the Sideview and this chart follows. Distances are shown in your preferred unit.
- Falloff and Correlation Readouts
The panel header shows the measured falloff of the dotted trace (in dB per doubling of distance, measured from its far-field slope) and a correlation readout comparing how closely the dotted and solid traces track each other. Click the falloff readout to overlay a constant-falloff reference grid on the chart; click it again to remove the grid.
Scroll to zoom the dB axis, drag to pan, and double-click to reset it.
As with all Panels, the SPL over Distance Panel can be resized and moved using Panel Drag & Drop, and ‘popped out’ into an additional System Optimiser window. The location of this Panel will be saved as part of the current tab.