Probes (Panel)
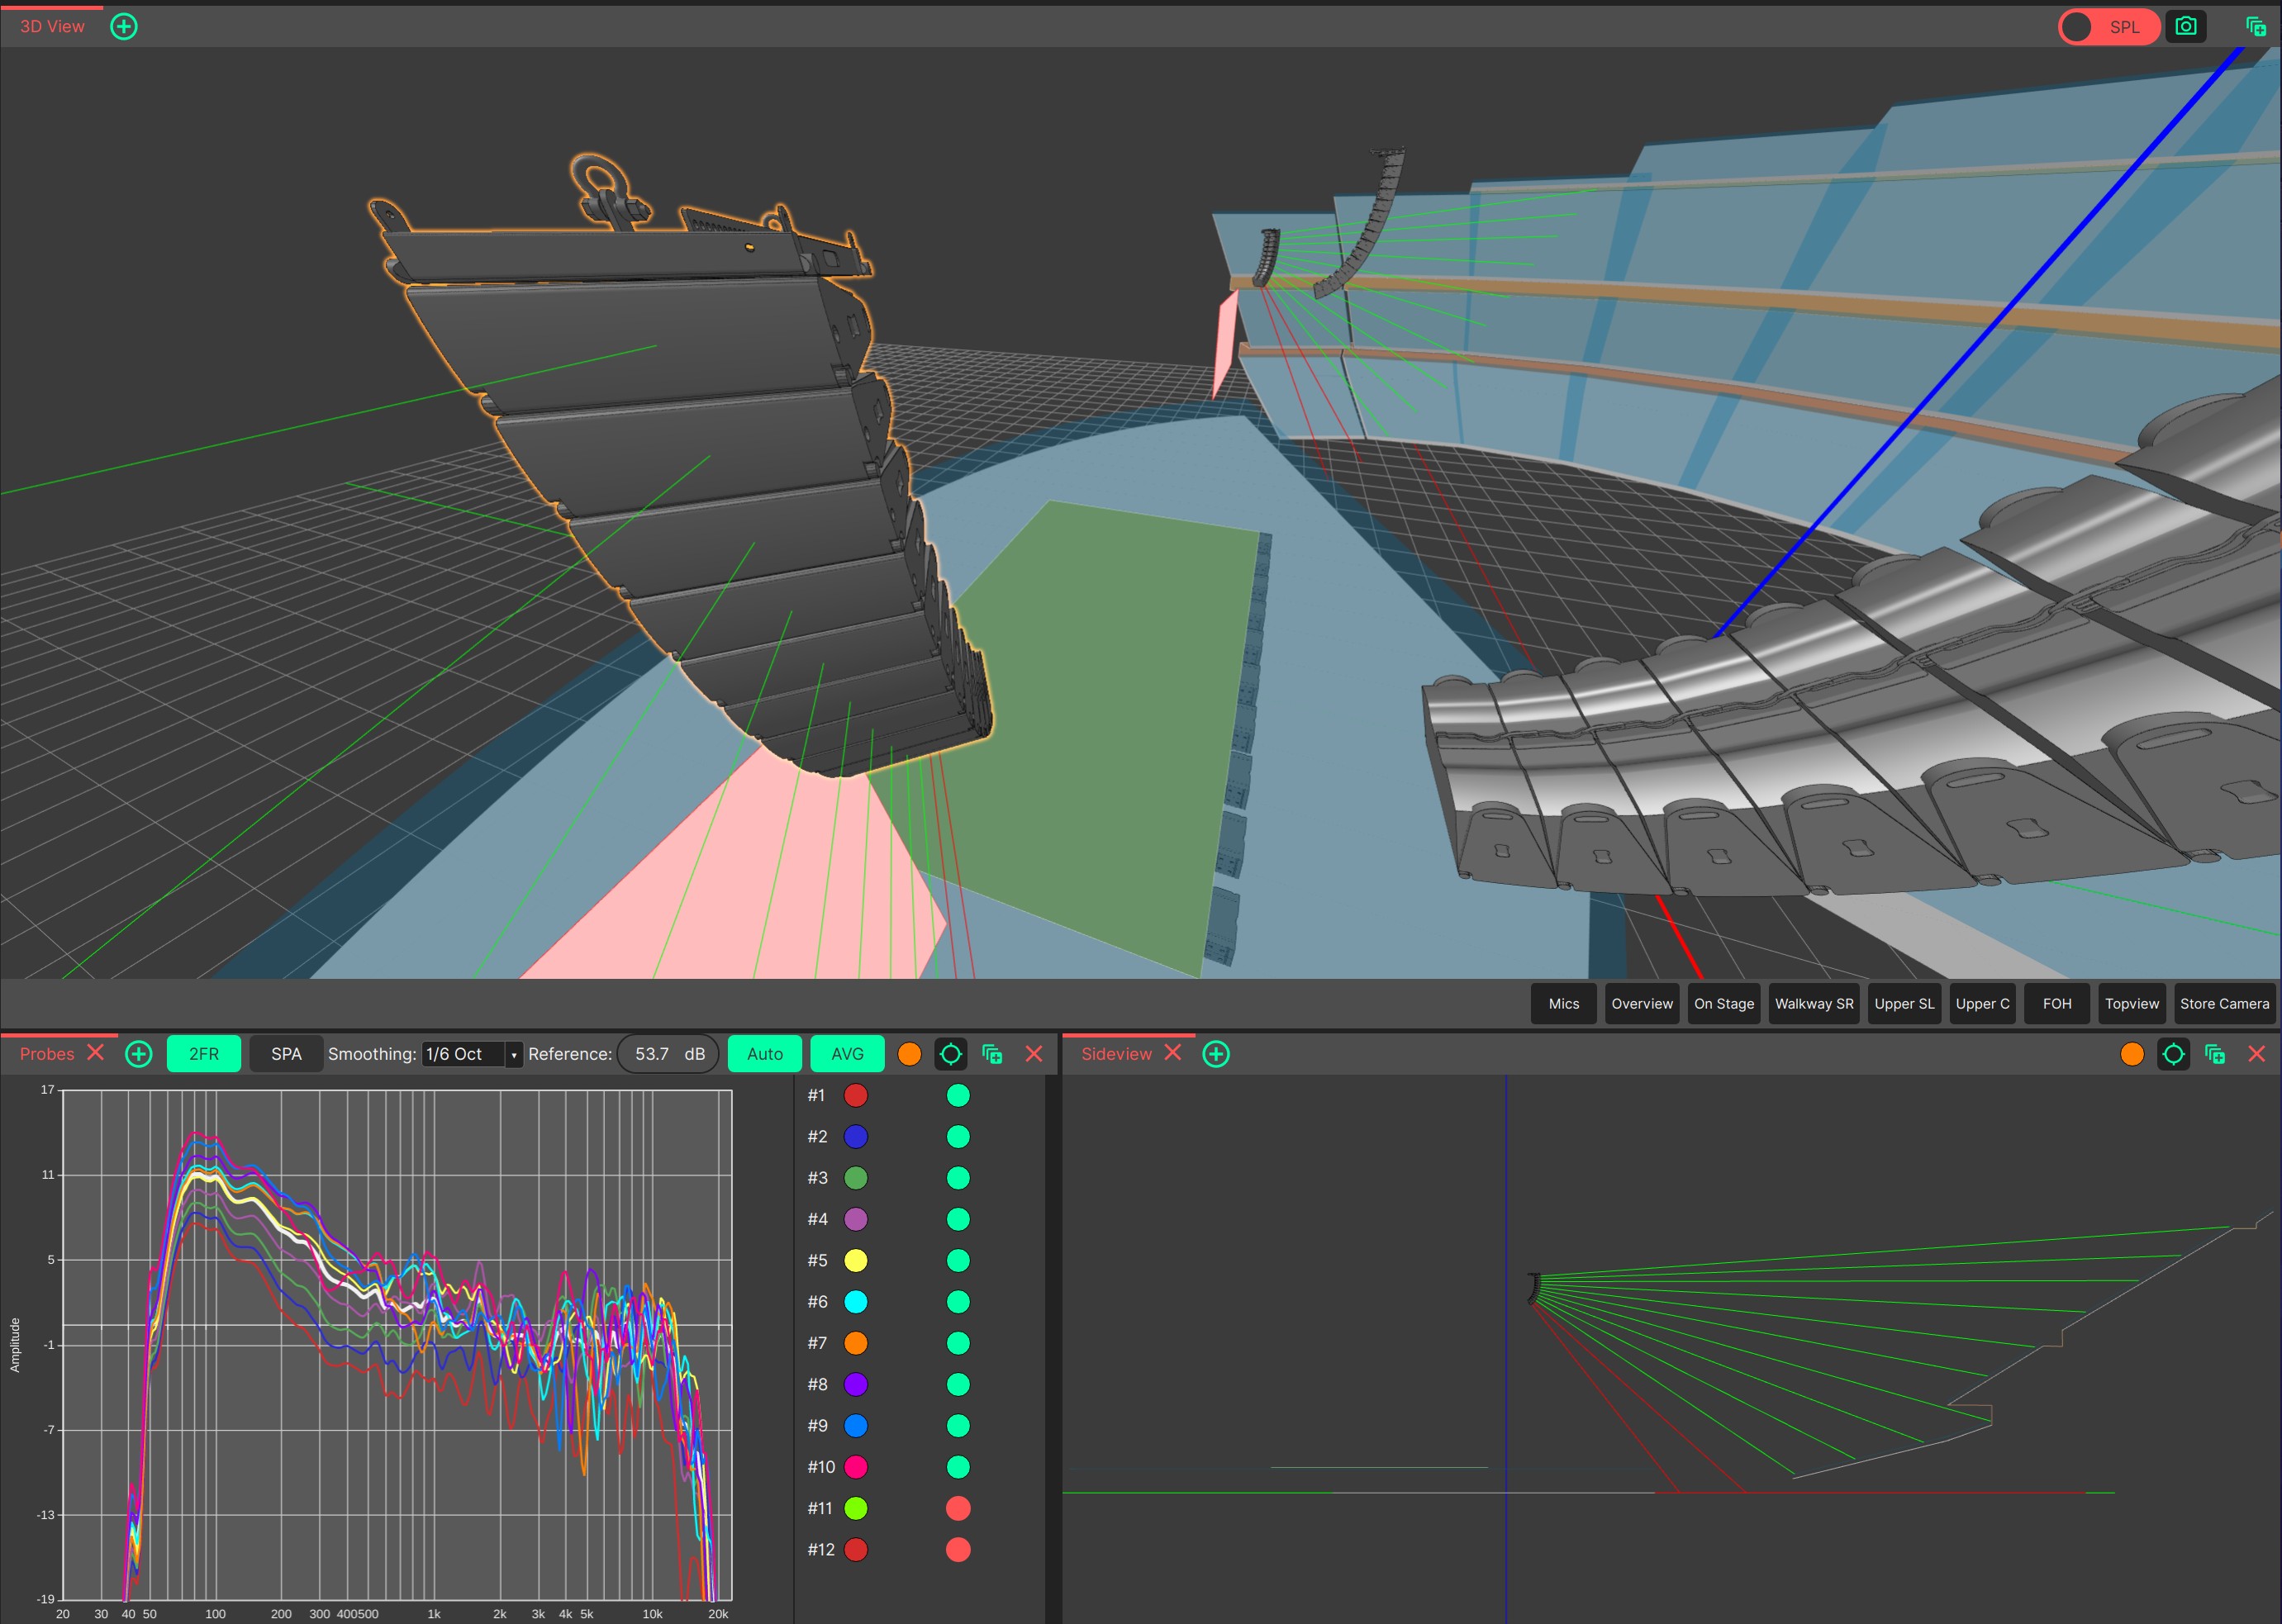
The Probes Panel is a frequency response graph which shows the transfer function at each point where main emission axis of a speaker in the array hits an
audience layer. To select an array, click it within the
3D View.
The probes are most useful for choosing the angles of a line array, in that the frequency response for the entire array can be seen in one view quickly, without having to place multiple
measurement microphones within the
3D View.
Probes can be thought of as measurements that are automatically generated at the intersection point of the selected loudspeaker’s
throw line on its main emission axis and the
audience ear height within the
3D View. The location of the probes are automatically updated as the loudspeaker’s position and angles are adjusted.
In the frequency response graph shown, only the selected array is taken into account (the array is soloed),
all other sources are ignored (muted). That means they also do not show any interaction, only the selected source, and hence
should not be confused with Microphones.
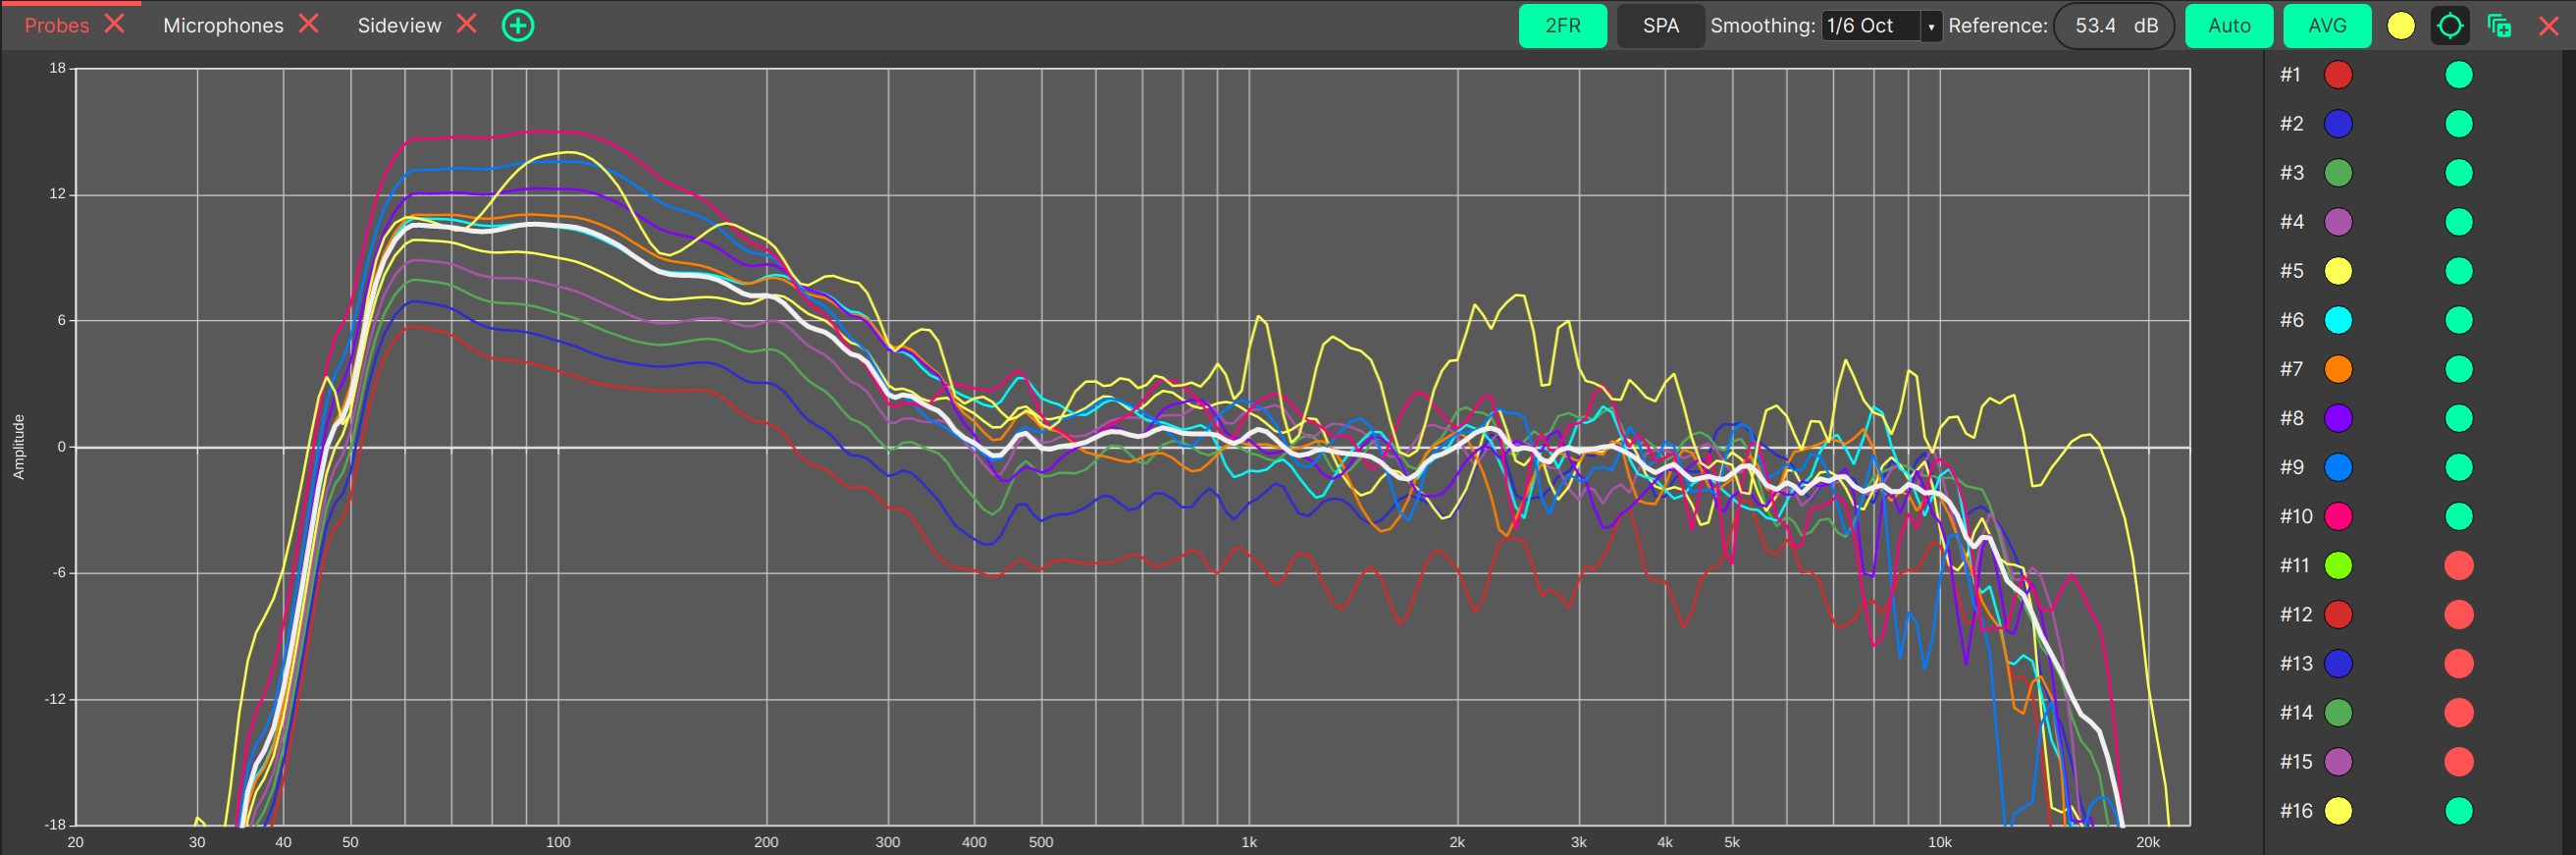
In the header menu, several options to influence the graph are available:
Smoothing for the graph can be adjusted using the drop-down list in the top-right of the Probes Panel.
The colour of the displayed traces will follow the global colour scheme, and will use a custom colour scheme if one is applied.
As Probes always use the 2FR mode, and the 2FR mode is supposed to show a transfer function, the absolute SPL response of the system must somehow be normalised (level shifted).
This is achieved by subtracting the value inside the Reference field from all curves. By default, this level is determined automatically by System Optimiser and the Auto button is selected. Determining where the 0dB line should be is a difficult question and is solved on a best-effort basis with a complex statistical analysis by System Optimiser. The automatically calculated Reference value can be overriden by deselecting the Auto button and entering a manual value.
To simplify the design process, an average curve can be plotted by selecting the AVG button. It is plotted in thick white to make it stand out.
Just like the
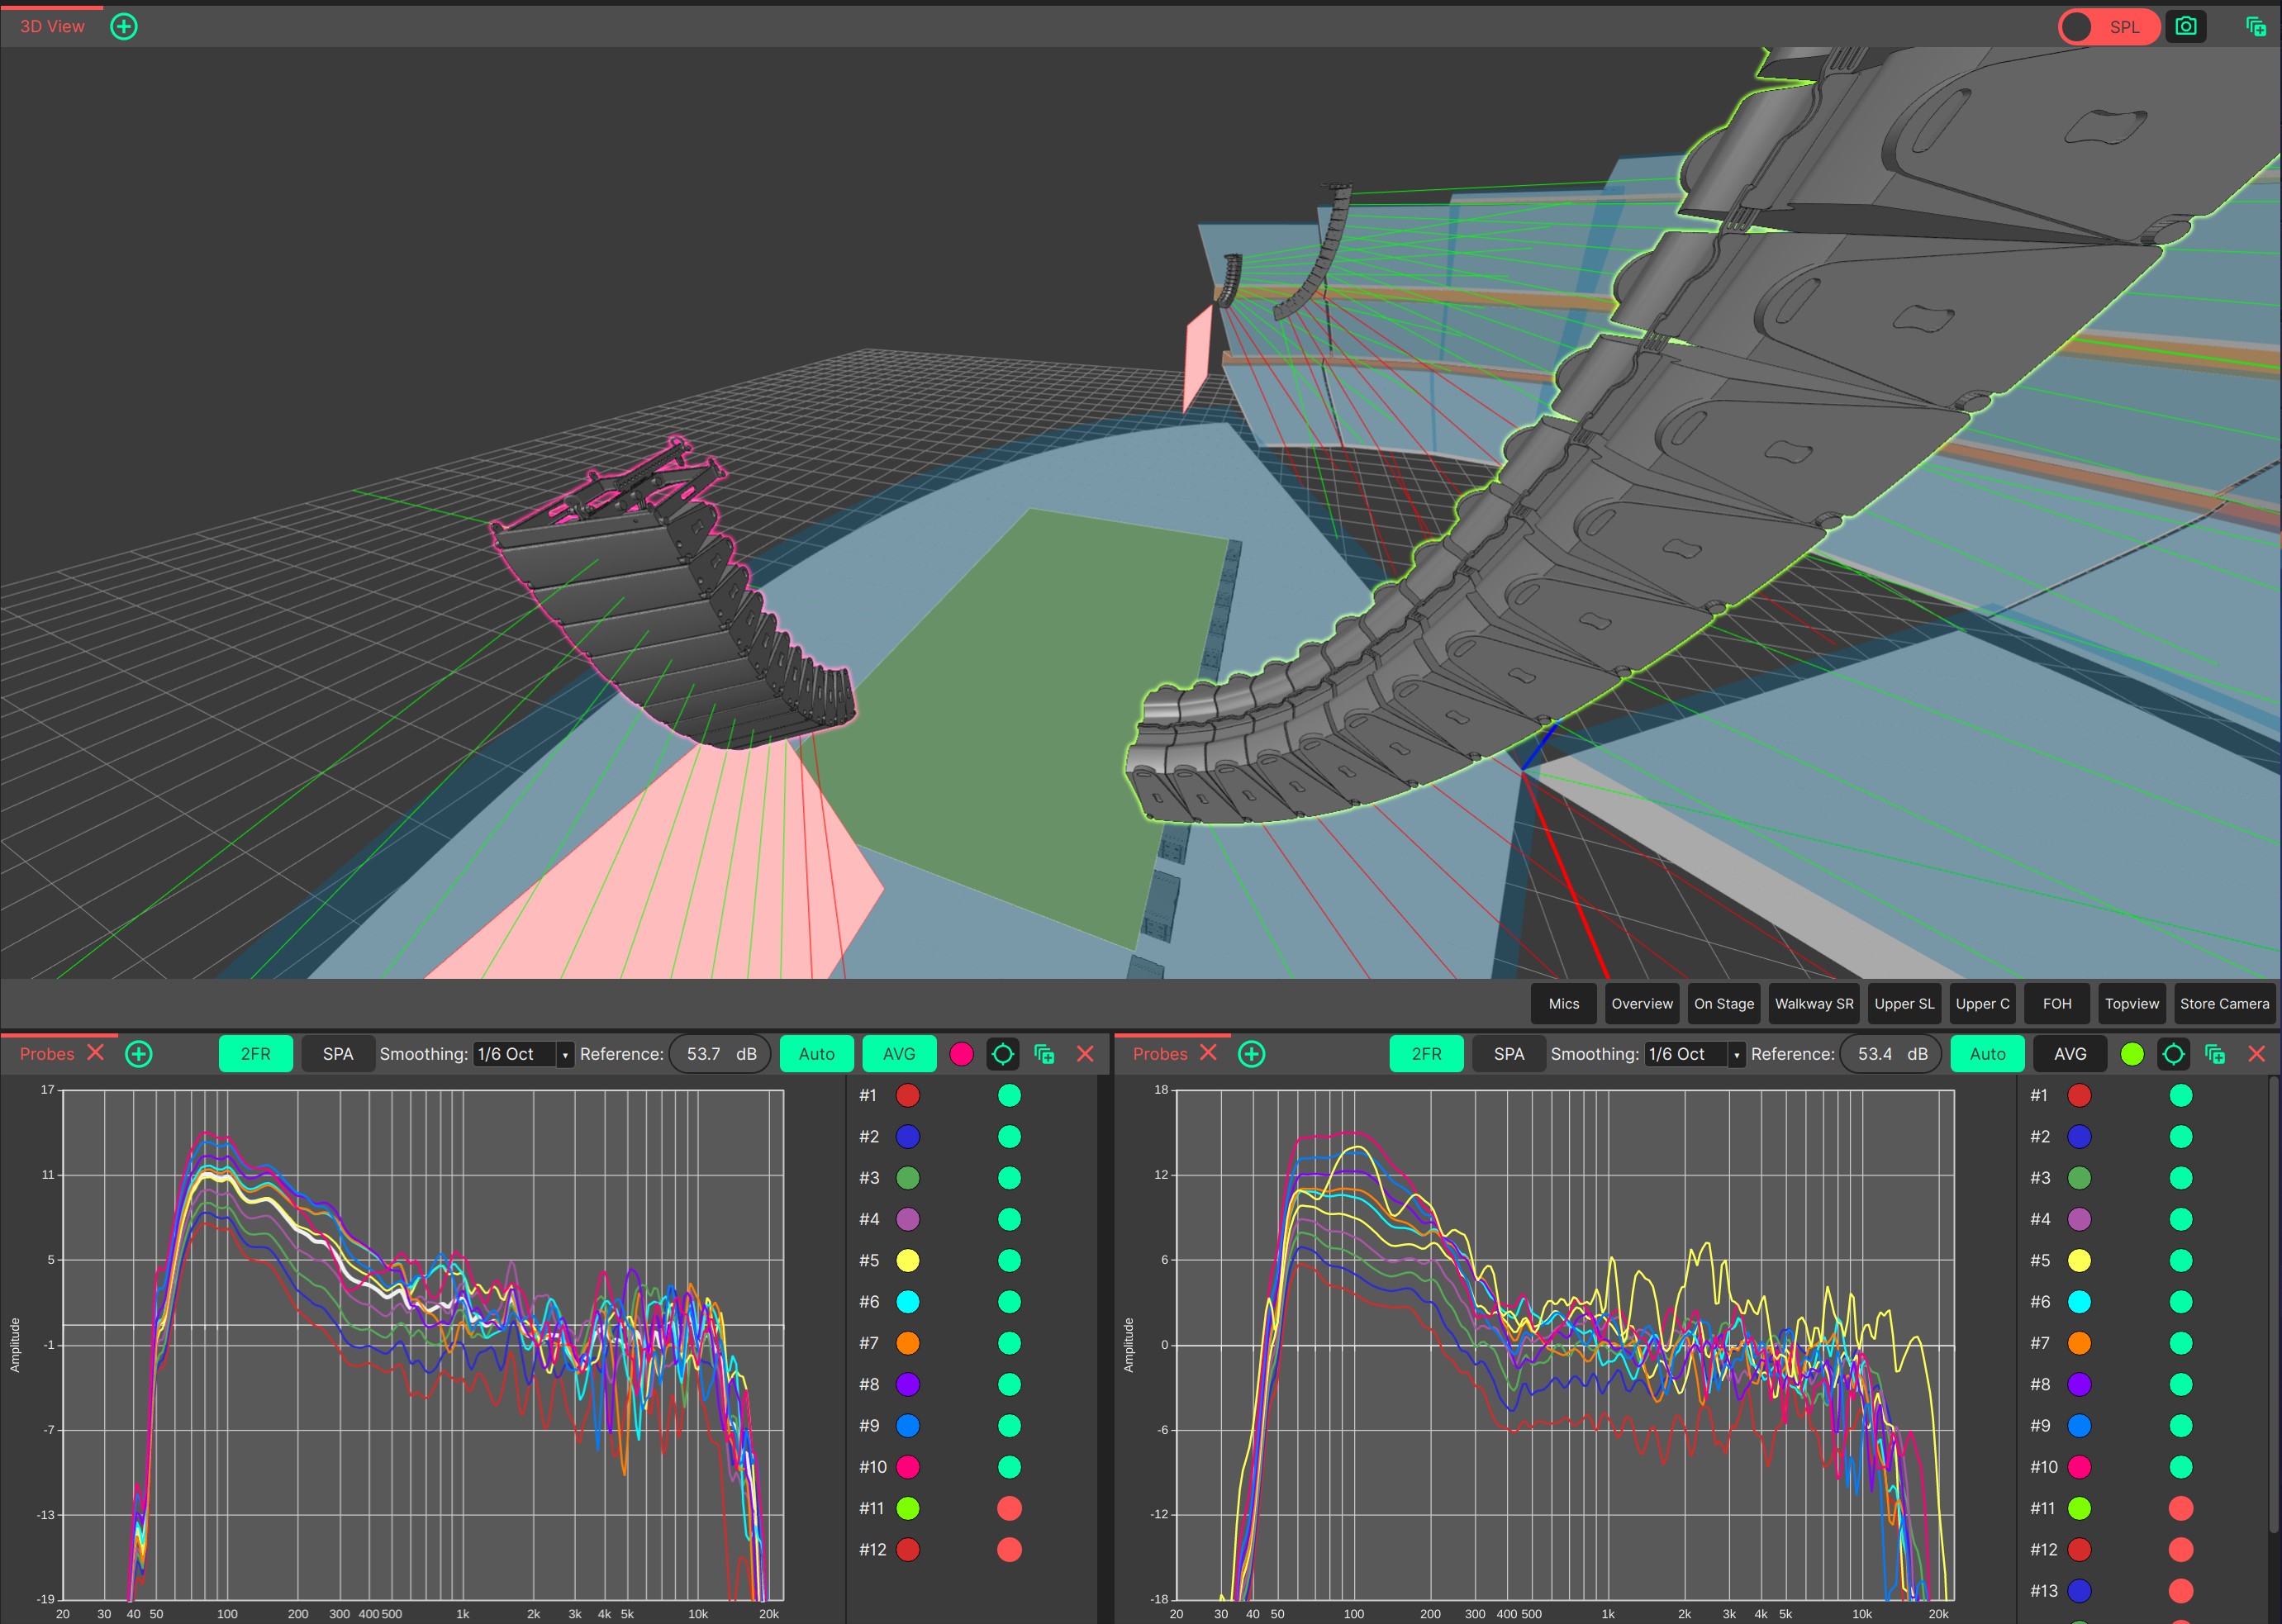
Sideview, Probes are fully integrated into the Multi-Window System and show a button with a specific colour and a crosshair on the right-hand side of their header. This allows having multiple independent Probes windows.
The colour shown in the header corresponds to the colour of the outline around the selected source in the 3D view (orange in the image below)!
If you click a loudspeaker in the 3D view, the default selection is made. The default selection applies is identical both Sideview and Probes. If you have not selected another array in the Sideview or Probes window, it always refers to the default selection.
If you wish to have multiple independent Probes or Sideviews, click the crosshair and then another array in the 3D view.
A new colour will be assigned and the specific Probes window is now independent of the default selection
Probes are not calculated for loudspeakers which do not hit
audience layers. If a Probe is not calculated, it is marked with a red button in the right column as can be seen in the picture. That means that the curve for each speaker always has the same colour, as opposed to versions prior to v0.6.
Single Probes can be individually disabled by clicking the green button in order to declutter the view if required. Disabling probes should be used with care, as the interactions between different elements in a Line Array are complex and can behave unexpected.
As with all Panels, the Probes Panel can be resized and moved using Panel Drag & Drop, and ‘popped out’ into an additional System Optimiser window. The location of this Panel will be saved as part of the current View Mode.